
Raster graphics and vector graphics

The basic classification of computer graphics:
- raster graphics - is a dot matrix data structure representing a generally rectangular grid of pixels, or points of color, viewable via a monitor, paper, or other display medium. The most important file formats: Bitmap, OpenRaster, ICO (Microsoft file format). The most important image editors: Photoshop, MS Paint and GIMP.
- vector graphics is the use of geometrical primitives such as points, lines, curves, and shapes or polygons, which are all based on mathematical expressions, to represent images inc computer graphics. Wszystkie te prymitywy graficzne bazują na równaniach matematycznych. The most important file format is SVG. The most important image editors: CorelDRAW, Adobe Illustrator and Inkscape.
Types of primitives commonly used in vector graphics:
• lines i polylines,
• polygons,
• Circles i ellipses,
• Bézier curves,
• bezigons,
• text e.g. TrueType.

Example showing effect of vector graphics versus raster graphics.
Rasterization is the task of taking an image described in a vector graphics format and converting it into a raster image (pixels or dots) for output on a video display or printer, or for storage in a bitmap file format. The most basic rasterization algorithm takes a 3D scene, described as polygons, and renders it onto a 2D surface, usually a computer monitor. Polygons are themselves represented as collections of triangles. Triangles are represented by 3 vertices in 3D-space. At a very basic level, rasterizers simply take a stream of vertices, transform them into corresponding 2-dimensional points on the viewer’s monitor and fill in the transformed 2-dimensional triangles as appropriate.
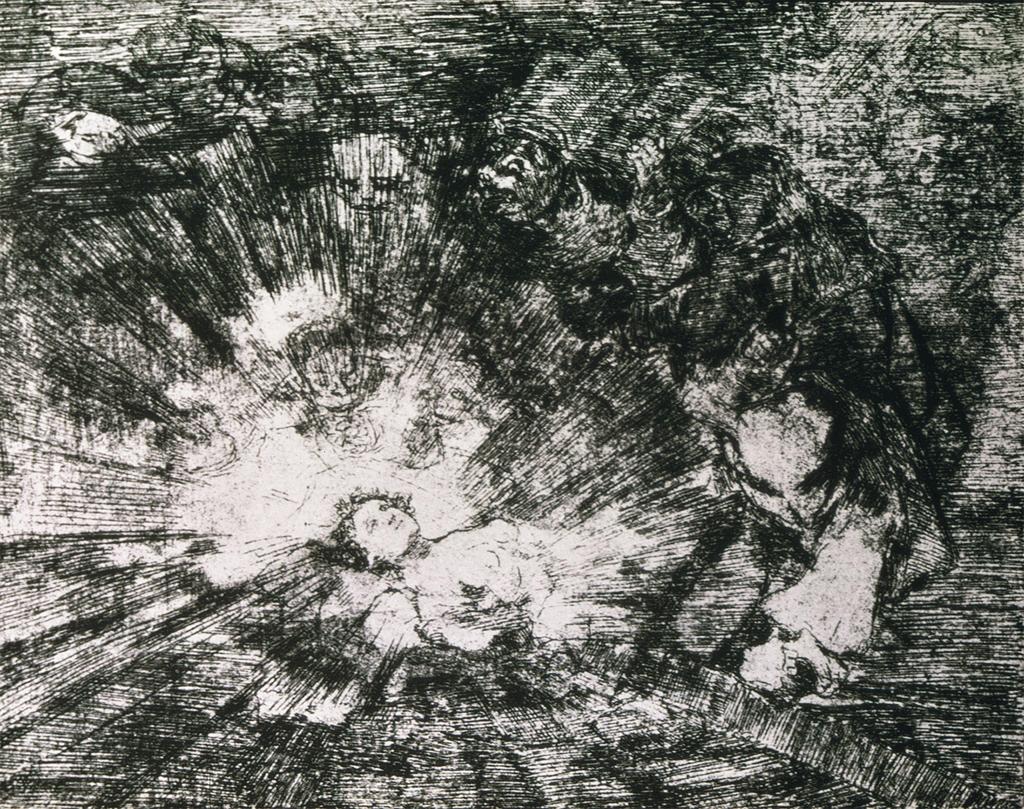
Example of graphic art that can be compared to vector due to the execution with the help of characteristic strokes of pencil may be drawings by Francisco de Goya.
 Francisco de Goya – The Disasters of War
A classic example of bitmap graphics is the art movement Impressionism.

Claude Monet -Argenteuil
Interesting...

Impressionism is a 19th-century art movement. Impressionist painting characteristics include open composition, relatively small, thin, yet visible brush strokes and emphasis on accurate depiction of light in its changing qualities. The main representatives of the Impressionists were Claude Monet, Edgar Degas, Auguste Renoir, Paul Cézanne. The central figures in the development of Impressionism in Poland were Olga Boznanska, Leon Wyczolkowski and Wladysław Podkowinski.
Advantages to this style of drawing over raster graphics:
- this minimal amount of information translates to a much smaller file size compared to large raster images. The size of representation does not depend on the dimensions of the object. A vector graphic with a small file size is often said to lack detail compared with a real world photo,
- correspondingly, one can infinitely zoom in on e.g. a circle arc, and it remains smooth. On the other hand, a polygon representing a curve will reveal being not really curved,
- on zooming in, lines and curves need not get wider proportionally. Often the width is either not increased or less than proportional. However, irregular curves represented by simple geometric shapes may be made proportionally wider when zooming in, to keep them looking smooth and not like these geometric shapes. This problem disappears in fractal graphics,
- the parameters of objects are stored and can be later modified. This means that moving, scaling, rotating, filling etc. doesn’t degrade the quality of a drawing. Moreover, it is usual to specify the dimensions in device-independent units, which results in the best possible rasterization on raster device,
- from a 3-D perspective, rendering shadows is also much more realistic with vector graphics, as shadows can be abstracted into the rays of light from which they are formed. This allows for photo realistic images and renderings.
Interesting...

Fractal graphics is a graphics which uses fractals- typically self-similar patterns, where self-similar means they are "the same from near as from far". Fractal graphics is used to generate random landscapes and geographical maps. The best-known figures of the fractal are Koch snowflake, Mandelbrot set, Cantor set and Sierpinski carpet. There are many programs designed to create fractal images, such as Gimp, Fractint, Ultra Fractal or FractalExplorer.
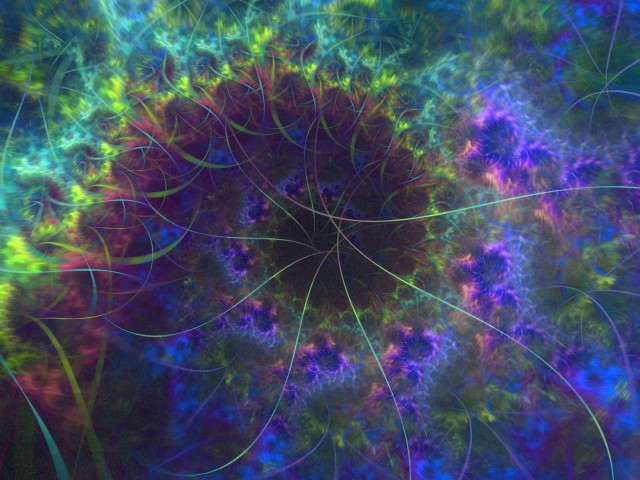
Fractal graphics
Display technology
Remember that the central issue in the preparation of the graphics is display technology.

- Perforated card
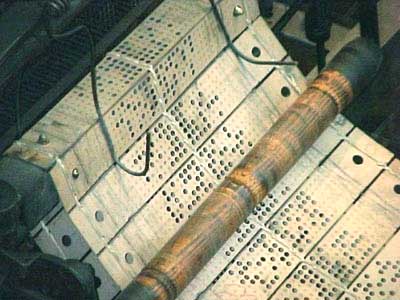
Perforated card: computer graphics is not really possible. Man made graphics (e.g. charts) based on the results with the computer.
Terminal with a roll of paper: computer graphics begins to be possible: raster graphic composed of ASCII characters.
Terminal ASCII: computer graphics begins to be possible in the dynamic version: raster graphic composed of ASCII characters.
Terminal vector: computer graphics begins to form vector graphics.
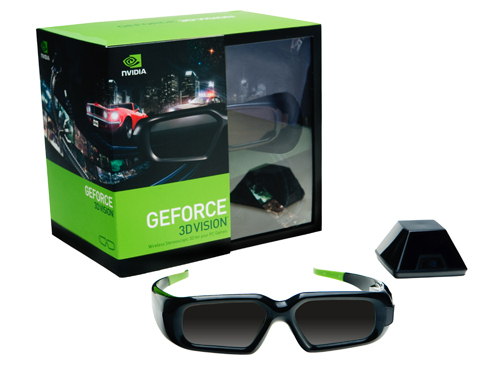
In the case of stereoscopic 3D glasses, for example NVIDIA GeForce 3D Vision, display device the human brain based on stereopsis.

- NVIDIA GeForce 3D Vision
Interesting...

Theoretical question - is it possible to produce two images of the object, for left and right eyes, so that the brain did not produce an image of this object? A similar phenomenon is used in silencing the noise with the twin acoustic wave with phase delay. Author: Szuba T.
Summary
The main difference between vector and raster graphics is that the bitmap image is composed of a finite number of dots (pixels), a vector image is composed of a finite number of shapes (lines, curves, polygons, etc.)
Parent page: Raster graphics and vector graphics


